Real-Time Telemetry and Analytics
The Two-Minute Gap That Costs More Than the Outage
At 10:01, every dashboard is green. By 10:03, customers are failing to pay, a queue is backing up, or a sensor reading is silently drifting out of range. The technical fault is rarely the real problem. The real problem is that the business found out too late — from a support ticket, an angry message, or a daily report that lands the next morning. Real-time telemetry and analytics close that gap. They are not about reports. They are about seeing what is happening while it is happening, and acting before the cost compounds.
For organizations in Uzbekistan — banks, logistics operators, retail chains, manufacturing, and government services — this distinction matters more every year. Systems are now distributed across mobile apps, payment gateways, IoT devices, and cloud backends. When something goes wrong in one of those layers, the question is no longer "what broke?" but "how long did it take us to notice?" Telemetry answers the second question, and that answer usually determines the size of the damage.
Telemetry vs. Reporting: They Solve Different Problems
It is tempting to treat real-time telemetry as "faster reporting," but they serve fundamentally different goals. Reporting is retrospective and aggregate: it tells you what happened over a period so you can plan. Telemetry is operational and continuous: it tells you the current state of the system so you can react. Confusing the two leads to building the wrong thing — a beautiful BI dashboard that refreshes every hour when what the operations team actually needed was a sub-second alert.
Reporting / BI analytics: answers "How did sales perform last month?" Latency of minutes to hours is acceptable. Optimized for historical depth, slicing, and human decision-making.
Real-time telemetry: answers "Is checkout working right now, and for whom?" Latency must be seconds or less. Optimized for detecting anomalies, triggering alerts, and feeding automated responses.
A mature platform needs both, but you should design them as separate paths. A common architectural mistake is forcing real-time signals through a reporting pipeline that was never built for low latency, then wondering why alerts arrive ten minutes after the incident.
What Real-Time Telemetry Actually Captures
Useful telemetry is layered. Each layer answers a different question, and skipping one leaves a blind spot that will eventually surface during an incident.
- Infrastructure metrics: CPU, memory, disk, network, container health. These tell you the platform is alive but say little about the customer experience.
- Application metrics: request rates, error rates, latency percentiles (p50, p95, p99), queue depth. This is where most real incidents first become visible.
- Business events: payments initiated vs. completed, orders created, logins, SOS signals, sensor thresholds. These connect technical health to money and outcomes.
- Distributed traces: the path of a single request across services, so you can see where the two seconds were lost, not just that they were lost.
- Logs with context: structured, correlated to a trace or request ID, so you can move from "something is wrong" to "this exact line" without guessing.
The most valuable signal is almost always the business event. Knowing that CPU is at 40% is comforting; knowing that the payment success rate just dropped from 98% to 71% is actionable. Always instrument the outcomes your business is paid for, not only the servers that produce them.
The Architecture Behind "Right Now"
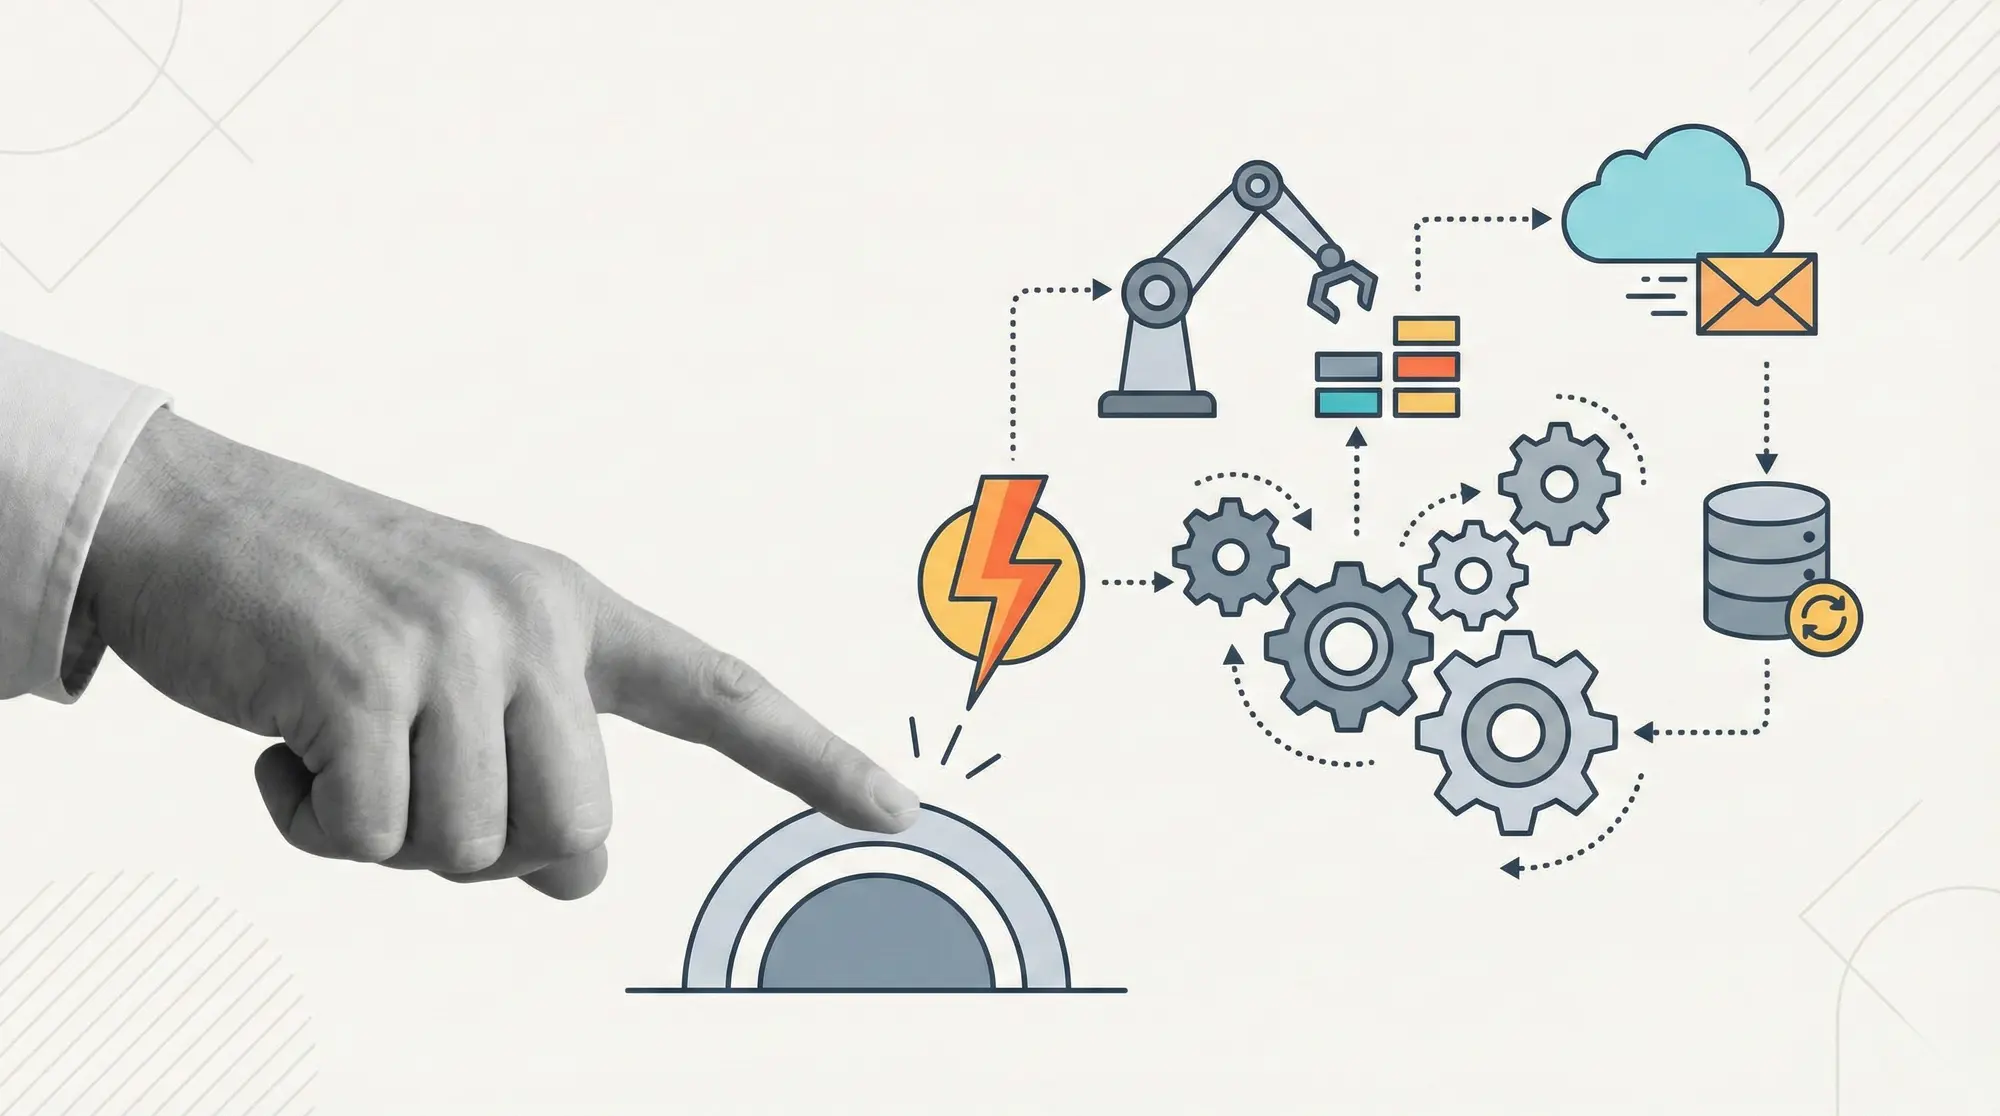
Real-time analytics has a recognizable shape, regardless of the specific tools. Data is emitted at the edge (apps, services, devices), shipped through a streaming layer that can absorb bursts without losing events, processed in motion to compute aggregates and detect anomalies, and then both stored for short-term querying and pushed to alerting and visualization.
The streaming layer — a message bus or event broker — is the part teams most often underestimate. It decouples producers from consumers, smooths traffic spikes, and lets you add new consumers (a fraud check, a live dashboard, an audit log) without touching the source. Stream processing then runs continuous queries: rolling error rates, moving averages, threshold breaches. Storage is split by purpose — a fast time-series or columnar store for recent data that powers live views, and cheaper long-term storage for historical analysis.
Key choice — build, buy, or blend. Off-the-shelf observability platforms get you to value fast and are usually right for standard infrastructure and application monitoring. Custom pipelines make sense when telemetry is the product (IoT platforms, fintech anti-fraud, real-time logistics) or when data residency, cost at scale, or domain-specific business events demand it. Most organizations in Uzbekistan are best served by a blend: a managed core for standard signals, plus a targeted custom layer for the business events that define their competitive edge — and with data residency requirements kept front of mind from day one.
Turning Signals Into Action
Telemetry that no one acts on is just expensive noise. The hard part is rarely collecting data; it is deciding what deserves a human's attention at 3 a.m. and what does not. This is where most monitoring initiatives quietly fail.
Common failure — alert fatigue. When every minor fluctuation triggers a notification, the team learns to ignore the channel entirely, and the one alert that mattered gets lost in the noise. Alerts must be tied to symptoms that affect users or revenue, have clear thresholds, and ideally point to a runbook. If an alert does not require action, it should be a dashboard panel, not a page.
Good practice is to alert on symptoms (payment success rate dropped, latency breached SLA), not on causes (one CPU spiked). Causes are for investigation; symptoms are for waking someone up. Define service-level objectives so "normal" is a number, not a feeling, and route alerts by severity so a minor warning and a revenue-stopping outage never look the same.
Practical Pitfalls Worth Avoiding
Several mistakes recur across projects, regardless of industry. Knowing them in advance saves months of rework.
- Instrumenting everything, prioritizing nothing. Collecting every possible metric inflates cost and buries the signal. Start from the questions you need answered during an incident and work backward.
- No correlation IDs. Without a shared request or trace identifier across services, logs and metrics cannot be stitched together, and debugging becomes archaeology.
- Ignoring cardinality. Attaching high-uniqueness labels (like user IDs) to metrics can explode storage and query cost. Use logs and traces for high-cardinality detail; keep metrics low-cardinality.
- Treating dashboards as the goal. A wall of green charts no one watches is not observability. The goal is fast detection and fast diagnosis, measured by how quickly you find and fix real problems.
- Forgetting data retention and cost. Real-time data is expensive to keep hot. Decide early what stays queryable for hours, what rolls up into aggregates, and what moves to cold storage.
A useful internal benchmark is your mean time to detection — the gap between when a problem starts and when your systems surface it. If that number is measured in minutes rather than hours, your telemetry is doing its job. If you cannot measure it at all, that is the first thing to fix.
From Reacting Late to Seeing Early
Real-time telemetry and analytics are an investment in time — specifically, the minutes between when something breaks and when the business knows. Those minutes decide whether an incident is a footnote or a headline. The right approach is not to instrument everything at once, but to identify the business outcomes that matter, build a clear path from signal to alert to action, and grow the system deliberately as you learn what "normal" looks like. If you are weighing how to give your platform real visibility — without alert fatigue, runaway cost, or blind spots — the team at OneDev would be glad to look at your architecture and help you map a telemetry strategy that fits your systems, your scale, and your data-residency requirements. Let's talk through your project.
What is the difference between monitoring and observability?
How fast does "real-time" actually need to be?
Do we need a custom pipeline, or are off-the-shelf tools enough?
How do we avoid drowning in alerts?
What does real-time telemetry cost to run?
Where should we start if we have no telemetry today?
Need a similar system or want to discuss your project?
Describe the task — we will propose architecture, technical approach and a work plan. A short call is usually enough to get started.
Discuss project